
Imagine being able to turn your complex server data into simple and easy-to-understand charts. That’s exactly what Grafana does. It helps developers and IT teams monitor their servers, applications, and system performance in one place.
Setting up Grafana manually can take time.
A faster and simpler option is to run Grafana using Docker, which lets you get started in just a few minutes and does not need any separate installation.
Docker enables you to get Grafana up and running in just a few minutes. The setup is simple, and you won’t need to install extra software manually.
Even if you have never used Docker before, this guide will help you out. We have given very clear steps from installing Docker to seeing your first Grafana dashboard in your web browser.
Let’s start.
What Is Grafana and Why Run It in Docker?
Grafana is an open-source platform for monitoring and visualizing data. It connects to various data sources, such as Prometheus, InfluxDB, MySQL, PostgreSQL, and Elasticsearch, and displays your data through customizable dashboards, charts, and graphs.
Developers and system administrators commonly use it to track server performance, application metrics, logs, and infrastructure health in real-time.
Why Run Grafana in Docker
There are several important reasons why you should run Grafana in Docker, like the following:
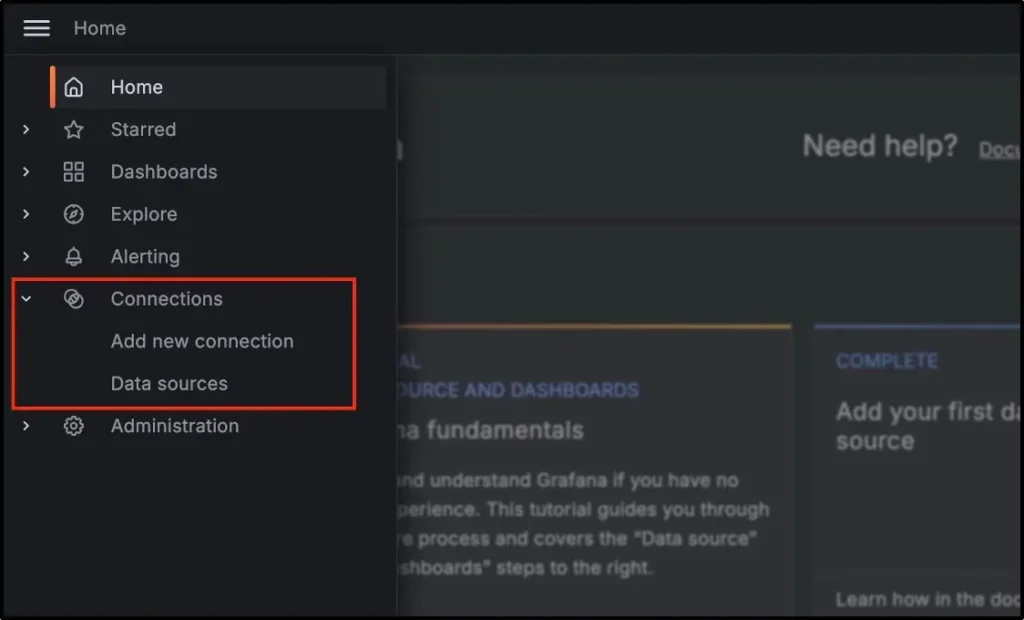
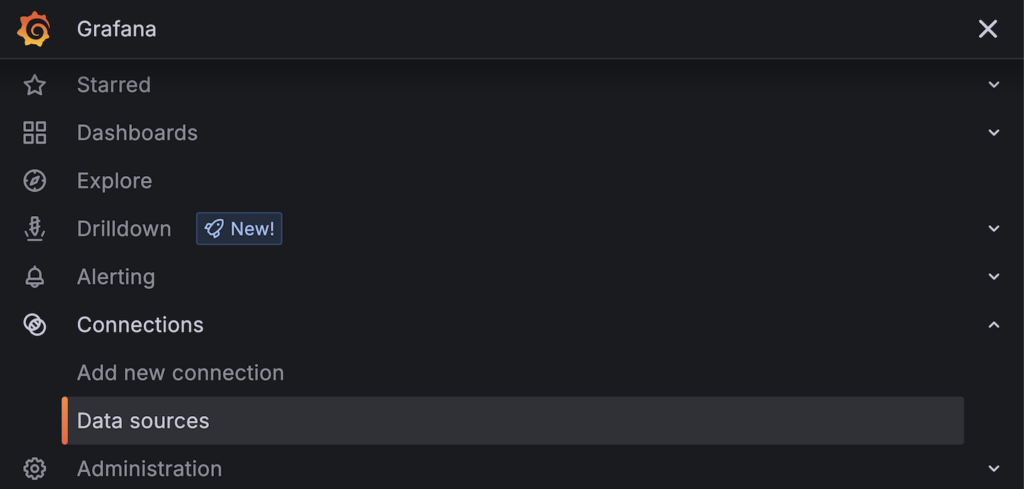
Once your Grafana is running in Docker, you can easily connect it to your data sources and start building dashboards in minutes.
What You’ll Need Before Getting Started
Before installing Grafana with Docker, make sure your system meets a few of the basic requirements.
Grafana is lightweight, so most modern computers can easily run it without issues, but it will be good if you check the table below:
| Requirement | Recommended Versio |
|---|---|
| CPU | 1 core minimum, 2 cores recommended |
| RAM | 512 MB minimum, 1 GB or more recommended |
| Storage | At least 2 GB of free disk space (more for storing large amounts of dashboard data) |
| Supported Operating Systems | Windows 10/11, macOS, Linux (Ubuntu, Debian, CentOS) |
| Install Docker First | Docker Desktop (Windows/Mac) or Docker Engine (Linux), version 20.10 or later |
Once your system meets these requirements and Docker is installed, you are ready to pull the official Grafana image and run it.
First Pulling the Official Grafana Docker Image
Before you can run Grafana, you need to download its official image from Docker Hub onto your computer. This image already contains everything Grafana needs to work, so you won’t have to uninstall anything separately.
Here’s how you can do it. Step by step.
NOTE:
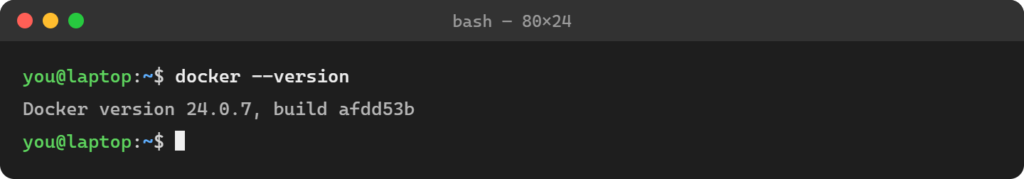
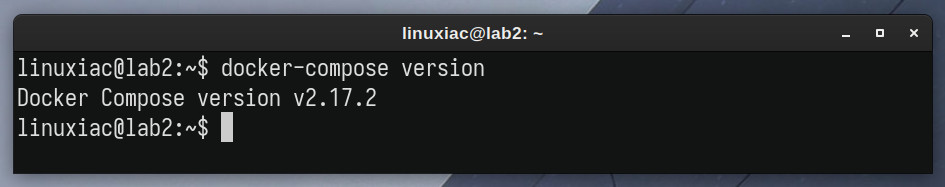
Make sure Docker is installed and running in the background before continuing. You can check this by trying the docker version. If it shows a version number, you are good to go.
Grafana comes in two editions: Grafana Enterprise Grafana is open source.
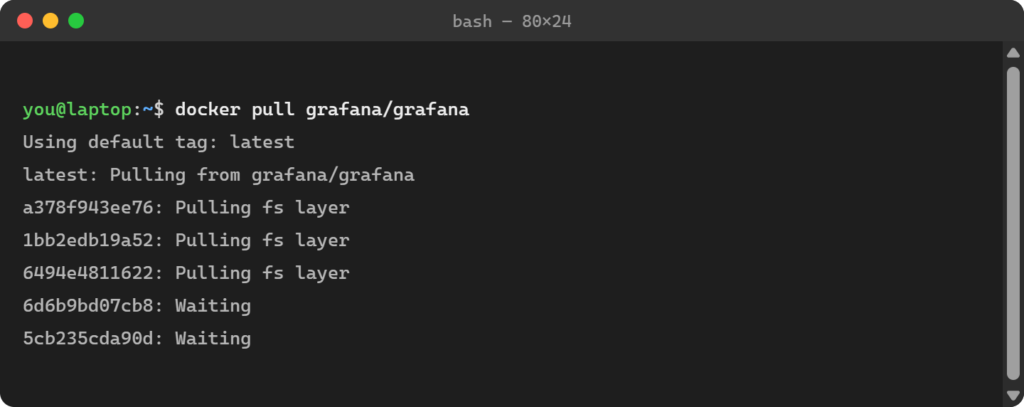
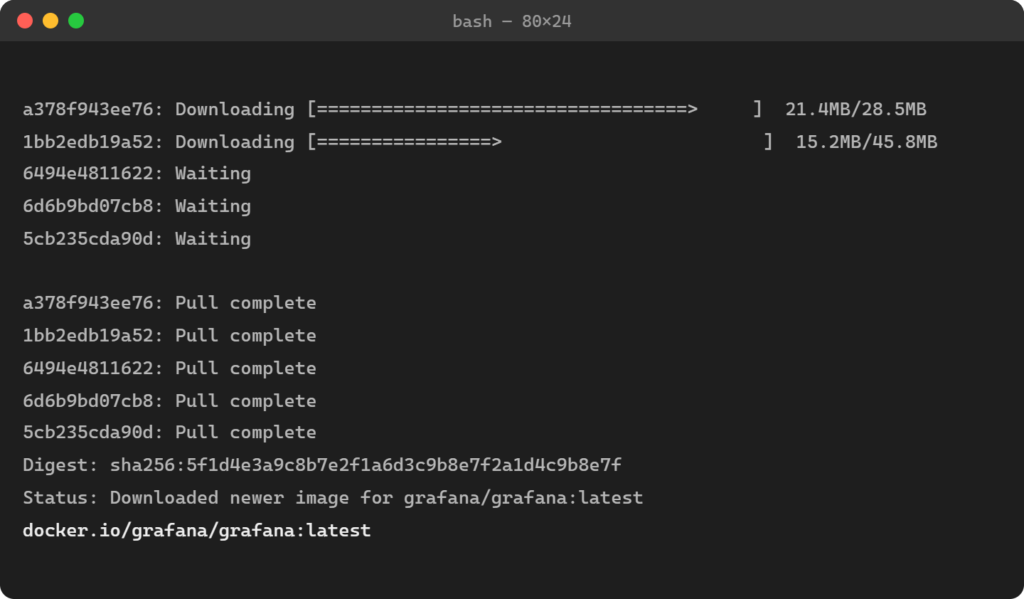
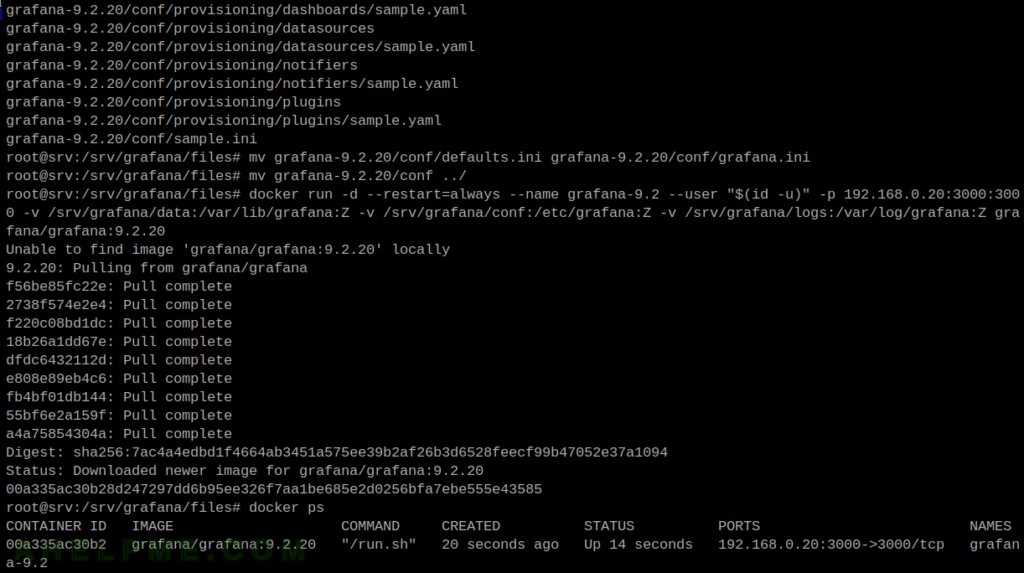
This tells Docker to download the latest stable version of Grafana from Docker Hub.
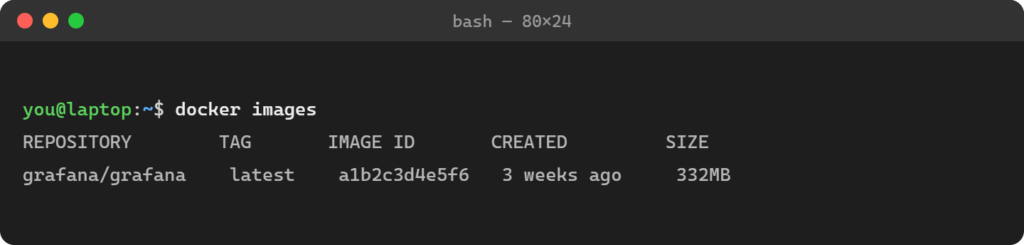
You should see Grafana/grafana in the list, along with its size and the date it was downloaded. This will confirm the image is saved on your machine and ready to use.
Once the image is downloaded, you are ready to run Grafana in a container.
NOTE:
If you need a specific version instead of the latest one, add a version tag to the command, for example: docker pull grafana/grafana:11.0.0. You can find all available version tags on Docker Hub.
How to Run Grafana with Docker (Step-by-Step Guide)
Now, we have come to the fun part: we will show you how to set up Grafana with Docker, from installing Docker itself to running Grafana as a container and mapping it to port 3000 so you can easily access it in your browser.
Just follow along, and by the end, you’ll have a fully working Grafana instance ready to build your dashboards.
Note:
On Linux, add your user to the Docker group or use `sudo` for Docker commands.
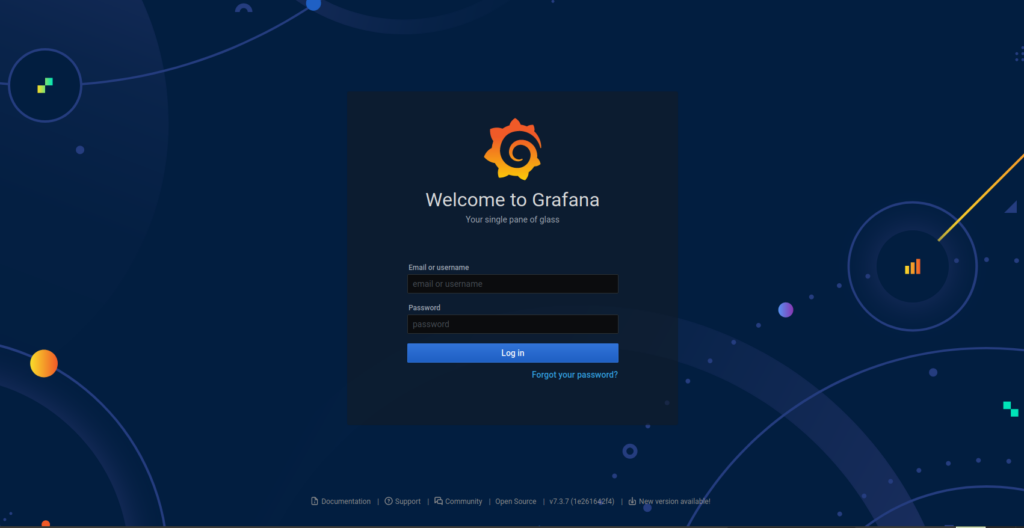
- Same machine: http://localhost:3000.
- Another device on the network: http://<host-ip>:3000.
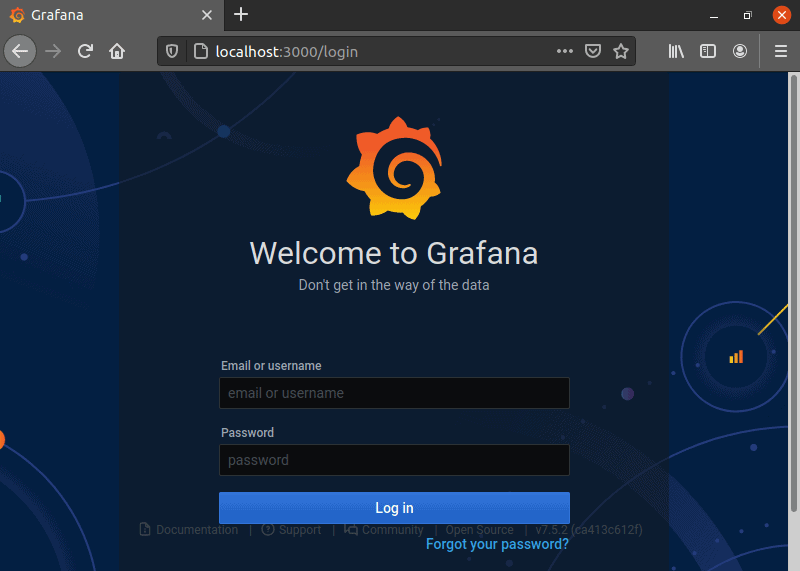
Note:
Grafana will immediately force you to set a new password; this is a security measure, not a bug.
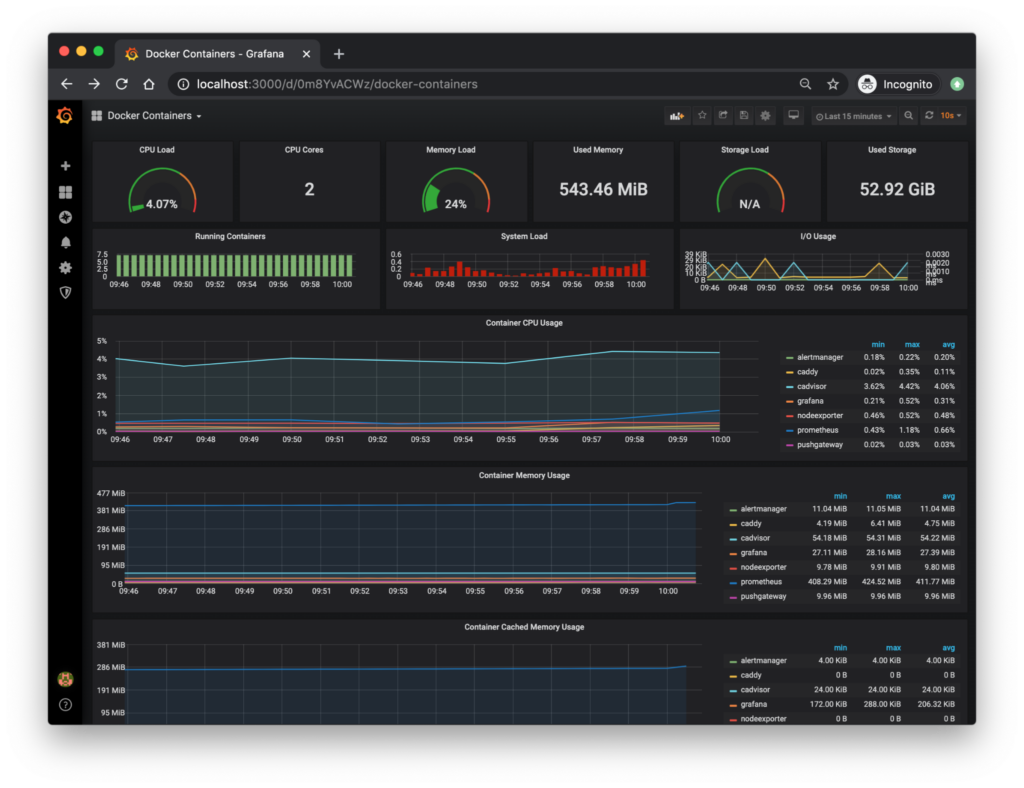
You now have Grafana running in Docker with persistent storage, a live data source connected, and a working dashboard to visualize your metrics.
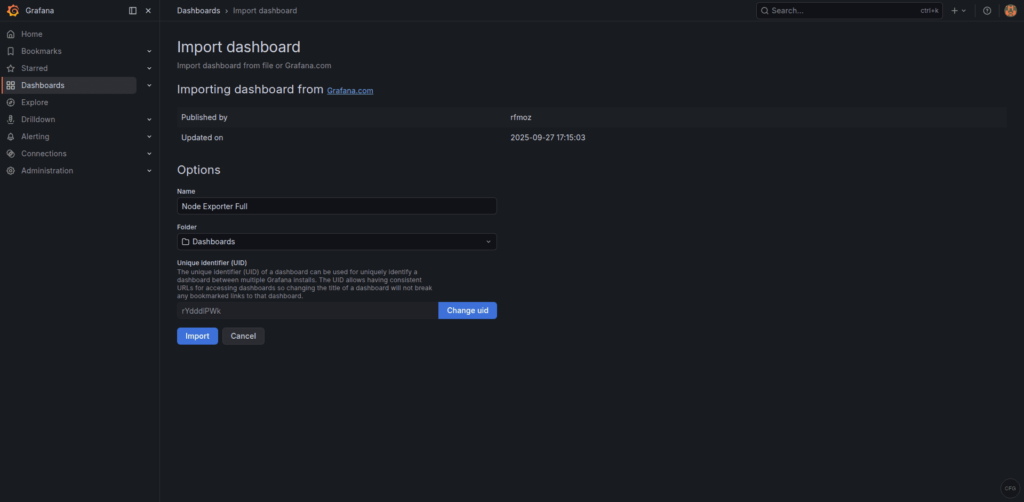
From here, you can explore prebuilt dashboards on grafana.com, set up alerts for critical tasks, or start building custom panels tailored to exactly what you want to monitor.
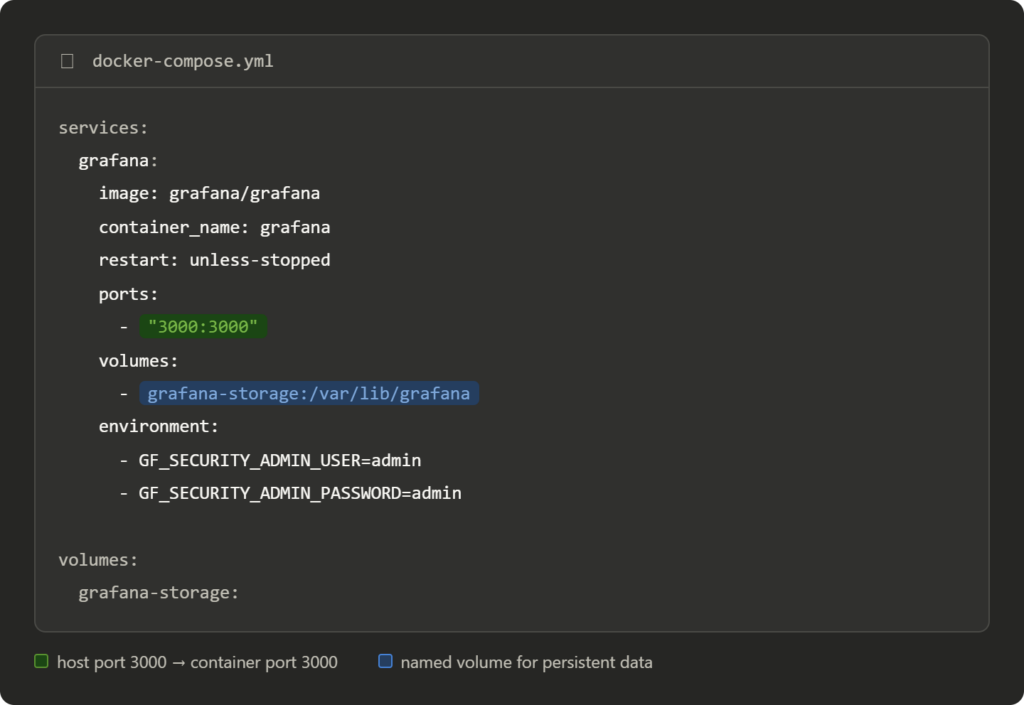
Deploying Grafana with Docker Compose
Now, here are some very easy and beginner-friendly steps so that you can get your Grafana running with Docker Compose. Follow them and easily have your Grafana with Docker Compose.
Note:
If you are deploying on a remote server, replace localhost with that server’s IP address, and make sure port 3000 is open in any firewall or security group.
You now have a fully functional Grafana instance running in Docker. From here, you can add your data sources, create dashboards to visualize metrics, and manage using a few commands.
As you grow, you can extend this setup with additional services like Prometheus for metrics collection, custom networking, and persistent backups.
Common Errors and How to Fix Them
Even with a simple setup, you might hit a few errors. Here are some of the most frequent issues beginners encounter when deploying Grafana with Docker.
1. Port Issues
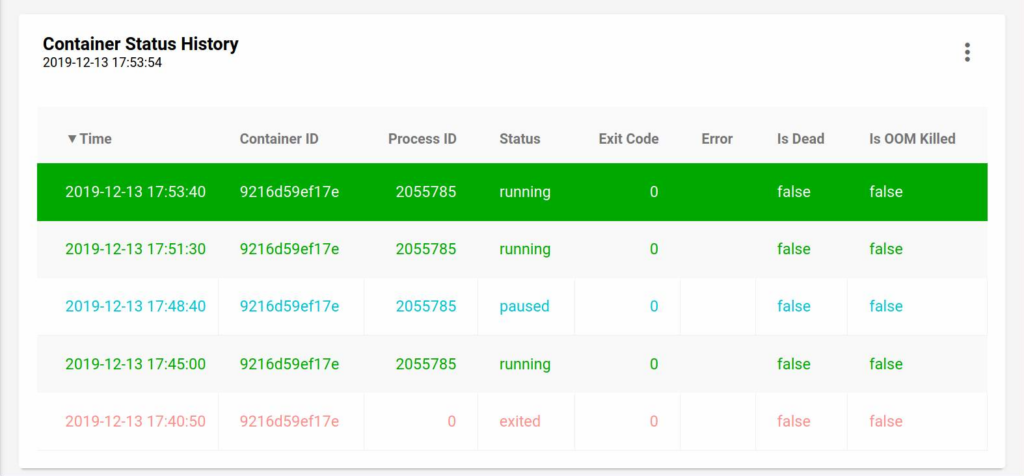
2. Container Won’t Start
3. Cannot access Grafana
4. If you forget your password
5. If you lose your data after a restart.
6. You are out of disk space
Most of the Grafana with Docker problems happen because of one of the three reasons, such as our data not being saved properly, your container not being able to reach the right address, or any of the settings being wrong.
Always check Docker logs first, and make sure you double-check your volume and settings, as they can fix most of the issues first.
Conclusion
Grafana with Docker is a simple way to get powerful monitoring dashboards running in minutes. Docker handles all your setup work, so you avoid installing extra software directly on your system, and you can remove everything cleanly when you are done.
Once your Grafana is up and running, it becomes the visual layer for your data and connects you to sources like Prometheus or MySQL, turning raw numbers into clear and useful dashboards.
This approach is especially useful for beginners because it is low-risk, as nothing touches your main system, and you can experiment freely.
Altogether, Docker makes Grafana accessible, flexible, and easy to maintain. It doesn’t matter if you are testing it out for the first time or building a long-term monitoring setup.
FAQs:
Why are my dashboards getting deleted every time I restart?
This usually happens because Docker containers do not save data by default; when the container is removed, everything inside it is lost too. You can fix it by mounting a volume so Grafana’s data lives outside the container.
Can I run Grafana and Prometheus together in Docker?
Yes, the easiest way is to use Docker Compose. Now, define both services in one Docker Compose. yml file, put them on the same network, and Grafana can pull metrics directly from Prometheus as a data source.
What port does Grafana use by default?
Port 3000. That is why you only have access to it at http://localhost:3000 after starting the container.
What is the difference between grafana/grafana and grafana/grafana-oss?
grafana/grafana is the standard image, which may include some enterprise features in trial mode. grafana/grafana-oss is the fully open-source version with no enterprise add-ons. It’s for most of the personal use or small projects only; Grafana-oss is the cleaner choice for you.
Is Grafana free to use with Docker?
Yes, the open-source (OSS) version of Grafana is free and runs the same way in Docker as any other image. You don’t require any license or payment for this. Paid plans will only apply if you choose Grafana Cloud or Enterprise features.
💡 Most Loved Article!