Ever felt irritated while collecting, cleaning, interpreting and visualizing complex datasets? Or found yourself spending endless hours manually identifying patterns, generating reports and forecasting trends from massive data piles? If you’re involved in data-driven tasks like business intelligence, marketing analysis, financial modeling, research analytics or performance tracking, chances are that you’ve faced these exact challenges.
From dealing with disorganized data and inconsistent entries to struggling with slow and repetitive analysis cycles, managing and making sense of data manually can be really difficult and even time-taking.
That’s exactly why professionals across industries are turning to AI tools for data analysis to simplify their work and get faster plus more accurate results.
To help you tackle these issues, this blog tells you the 5 best AI tools for data analysis that you can rely on. We’ve included each tool’s top unique features, pricing schemes, and free trial availability so you can try them out with zero risk before making any investment.
Also, a huge applause to our technical research team, who spent days and nights! rigorously testing and reviewing each AI tool’s performance, accuracy, speed, and overall reliability. The tools mentioned in this blog are 100% tested and have a proven track record of delivering results.
So, keep reading as we’ve listed the tools that can truly revolutionize the way you work with data!
Why Is Data Analysis Important?
See! Data analysis plays an important role in helping people make smart decisions. Every day, professionals collect loads of information, but just collecting it isn’t enough. They need to understand what that data means. That’s where data analysis comes in. It helps understand raw numbers, find useful patterns and see what’s working and what’s not. Without it, it’s like having a map but not knowing how to read it.
Data analysis is used in almost every field you can think of:
Over time, data analysis has helped solve many real problems. For example, businesses can now figure out why sales dropped during a specific month or what type of advertisement brings the most traffic. By understanding this, they can make changes quickly. This leads to better planning, fewer mistakes and higher productivity. Teams work smarter because they’re guided by facts instead of guesses.
Now, with the help of AI tools, data analysis has become even faster and more accurate. These tools can process huge amounts of data in seconds, something that would take humans days or even weeks.
AI tools also reduce errors, which means the results are more reliable. Plus, they can spot trends or outliers that a human might miss. This ensures deeper insights and smarter outcomes.
List of Best AI Tools for Data Analysis in 2025
To help you quickly find the right tool for your needs, we’ve added a small and helpful table below that includes the top 5 best AI tools for data analysis.
The table includes the tool name, key features, and starting price, so you can compare them easily and make smart choices without wasting your time searching around. Let’s say you’re just starting or already deep into data analysis, this list is made to guide you clearly.
| Data Analysis Tools | Key Features | Best For | Free Trial | Starting Price |
| Domo | Natural-Language AI Chat Assistant, Beast Mode Editor for Metrics & Embedded Analytics | Data Analysts & BI Developers | 30-day Free Trial | $10K per year |
| Talend | AI‑powered orchestration, Over 1,000 connectors & Automatically monitors data | Data analysts, Engineers & Data architects | 14 days Free Trial | $12,000 per year |
| Tableau | Plain‑language Root‑Cause & Action Insights & Conversational AI Assistant | Business Analysts & Data Scientists | Free Trial available | $70 per user per month |
| Power BI | Automatically identifies and ranks factors, Natural‑Language Q&A & AutoML Integration | BI Analysts & Supply‑Chain/Data Analysts | 60-day Free Trial | $14 per user per month |
| Sisense | AI-driven textual explanations, Embedded within analytics workflows & Toolkit | Data Engineers/Analysts & Developers | 30-day Free Trial | $40K per year |
Domo
First in the list, our tech-team has named Domo, a widely regarded AI tool for data analysis, offering a nice end-to-end platform that effortlessly handles everything from connecting your data sources to generating powerful insights via machine learning and embedded analytics. With over 1,000 connectors, it enables seamless integration with cloud and on-prem systems, ETL processes, SQL/data prep tools, and drag‑and‑drop dashboard creation.
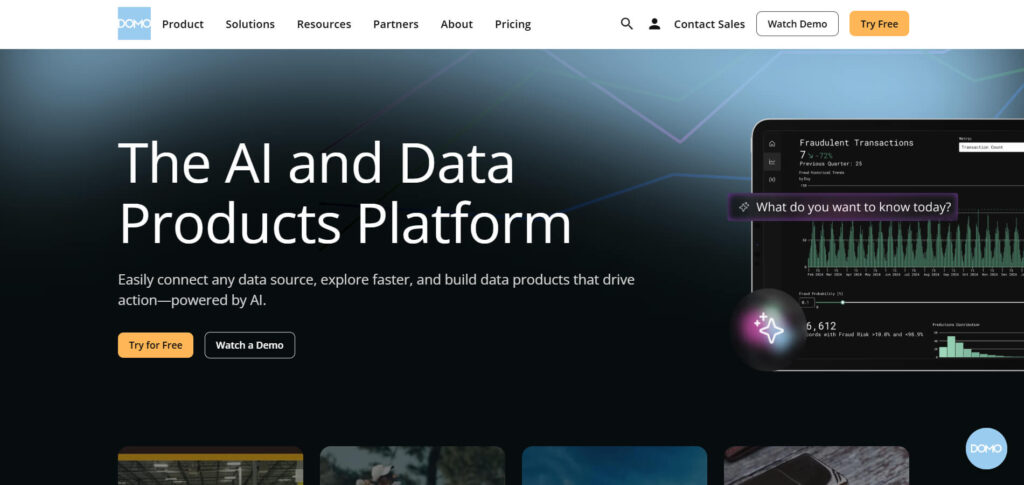
At its core, Domo simplifies data by combining user-friendly features like Magic ETL, SQL dataflows, and the Beast Mode metric editor with robust AI layers. Its Domo.AI offers natural‑language chat (AI Chat), AI‑guided automated workflows, forecasting, anomaly detection, and even image/video analysis.
Features
Use Cases
Target Audience
Pricing
Free Trial
Talend
Second, we’ve Talend Data Fabric, a low-code platform, designed for modern data management, offering a full suite of solutions from data integration and quality to governance and observability all in one unified environment. The platform helps data analysts and engineers effortlessly connect to virtually any data source, cloud, hybrid or multi‑cloud, transforming raw inputs into trustworthy, analytics-ready datasets.
Over time, Talend has enhanced productivity by adding data observability capabilities, letting teams proactively monitor data quality trends, identify anomalies in real time, and trust their datasets via the proprietary Talend Trust Score, a unified health indicator. Its simple drag‑and‑drop interface, along with low-code orchestration, makes it especially friendly to newcomers, enabling quick onboarding and accelerated learning curves without sacrificing control.
Features
Use Cases
Target Audience
Pricing
Free Trial
Tableau
Next is Tableau that offers a powerful, AI-augmented analytics platform that enables teams to accomplish data analysis tasks quickly and effectively. With its intuitive visual interface, users can explore data through drag-and-drop charts and dashboards without needing advanced technical skills. The addition of AI capabilities, such as agentic analytics via Tableau Next and generative AI with Tableau Agent, automates complex data-prep, anomaly detection, and insight generation, reducing manual effort and accelerating time-to-insight.
Analysts gain speed through AI-enhanced workflows like business leaders receive timely, trustworthy insights for informed decision-making and IT professionals benefit from robust governance and seamless integration with Salesforce & Data Cloud. Even newcomers with little-to-no data experience can ask questions naturally via the Concierge feature and rely on guided suggestions to build visualizations confidently.
Features
Use Cases
Target Audience
Pricing
Free Trial
Power BI
This option is our tech-team’s favourite! Microsoft Power BI (Business Intelligence), wanna know why? See! It is a robust data visualization and reporting platform designed to transform raw data into interactive insights. It supports desktop (Power BI Desktop), web (Power BI Service/Pro/Premium), mobile, embedded analytics, and on-premises via Report Server. By unifying connectors (Excel, databases, web, and more) into a single interface, teams can build dashboards, charts, maps, KPIs, and even AI‑powered visuals.
This intuitive, low‑code environment makes complex analytics accessible to both data pros and non‑technical users. Power BI has revolutionized data analysis by delivering real-time, scalable, and collaborative intelligence. It enables organizations to track metrics on live dashboards, predict trends with machine learning models, and empower cross-functional teams to make data-driven decisions.
Features
Use Cases
Target Audience
Pricing
Free Trial
Sisense
And lastly, we’ve Sisense option as well that offers a robust AI-driven analytics platform designed to empower businesses and professionals with data-driven decision-making capabilities. By unifying data modeling, visualization, AI insight generation, and embedding, Sisense enables organizations to transform raw data into actionable intelligence at speed and scale.
Sisense Intelligence harnesses generative AI, natural language queries, and contextual analytics to simplify otherwise complex data tasks like forecasting, trend detection, and root-cause explanation. This allows both expert analysts and business users to explore data effortlessly and gain insights faster.
Features
Use Cases
Target Audience
Pricing
Free Trial
Why do organizations need an AI data visualization tool?
Data visualization is a very important part of any organization because it helps turn raw numbers and complex data into easy-to-understand visuals like charts, graphs, and dashboards. These visuals help teams and decision-makers quickly understand what’s working and what’s not.
AI can automatically find patterns, highlight trends, and even suggest the best ways to present the data. This not only saves time but also improves the accuracy of business decisions. Here are the top 5 reasons why organizations need an AI data visualization tool:
Faster Decision-Making
AI visual tools can quickly process large amounts of data and display the results in simple visuals. This allows teams to make decisions faster without spending hours analyzing reports.
Spotting Trends and Patterns
AI can automatically detect trends that may not be visible to the human eye. This helps companies plan ahead, adjust strategies, and stay ahead of the competition.
Less Manual Work
These tools reduce the need to create graphs and charts manually. With just a few clicks, AI creates complete dashboards and visual reports, saving hours of manual effort.
More Accurate Insights
AI tools analyze data deeply and reduce the chances of human errors. This means the visuals are more reliable, and decisions made based on them are safer.
Better Team Collaboration
When data is presented visually, everyone from managers to non-tech team members can understand it easily. This improves communication and helps teams work better together.
Benefits of Using AI Tools for Data Analytics
Using AI tools for data analytics can completely change how a business runs. They also save a lot of time by automating repetitive tasks like data sorting, cleaning, and reporting. AI tools help businesses understand customer behavior, improve marketing, boost sales, and track performance without needing deep technical knowledge. Here are the top 5 benefits of using AI tools for data analytics:
Quick Insights for Faster Decisions
AI tools process data in seconds and highlight key findings. This means businesses don’t have to wait days or weeks to make decisions, they can act immediately.
Automated Data Cleaning and Sorting
AI automatically removes duplicate, incorrect, or missing data, making the analysis much cleaner and more accurate without manual effort.
Predictive Analytics
AI doesn’t just show what’s happening now, it can also predict what’s likely to happen in the future. This helps businesses prepare in advance and reduce risks.
Cost and Time Saving
By reducing manual work and increasing the speed of analysis, AI tools save both time and money. Small teams can do more in less time with fewer resources.
Easy-to-Use Dashboards and Reports
Most AI tools offer user-friendly dashboards where you can see results visually. This helps anyone, even non-technical users, understand the data clearly.
FAQs
Are AI data analysis tools expensive?
See! Prices always depend on what you need. If you go for ready-made tools, annual plans range from free up to around $20K. Custom-built systems cost more, starting at about $40K and often going much higher. So, you can start small with pre-built options or invest more for bigger setups.
Can AI tools integrate with other software?
Yes! Most AI tools are designed to connect with your existing apps. Integration guides and connectors are common in platforms like Alation, SnapLogic, AnyLogic and others.
That means they can share data with tools like CRM systems, databases, and dashboards. Tools labeled no-code let you do this without any programming, making it easy to plug AI into current workflows.
How secure are AI data analysis tools?
Many top tools follow strong data protection standards like GDPR, use encryption, audits and access controls . Risks include data leaks, prompt‑injection, shadow‑AI use and supply-chain tampering.
But when trusted systems are chosen and best practices followed, like monitoring use, encrypting data and using secure enclaves, AI tools can be safe to use.
Can I use AI for data analysis?
Yes! AI is now a helpful assistant. It helps with tasks like cleaning data, spotting unusual trends, forecasting, text or image analysis, and even building dashboards via natural language.
Experts support using AI to speed up repetitive work while analysts focus on important thinking tasks Many platforms like Tableau, Power BI, now include AI features.
Conclusion
We see that data analysis is really important for making informed decisions and solving problems effectively. And with AI tools, it’s not just faster, it’s smarter, more detailed, and much easier to manage. Businesses that use AI-powered data analysis can move quicker, stay ahead of competition, and get better results without adding extra work for their teams.
At a time when everyone is embracing AI to improve their productivity, using AI tools for data analysis is a smart move. It helps you eliminate repetitive manual tasks, cut down hours of workload, and focus on interpreting results rather than just compiling them.
For our targeted users, be it data professionals, marketers, analysts, or decision-makers, these tools have significantly simplified their workflows. They no longer have to spend hours wrangling data and can now deliver insights with better speed and accuracy.
In this blog, we’ve shared a carefully curated list of the top 5 AI tools for data analysis, each backed by tested features, transparent pricing, and free trial options. These tools are not just functional, they’re efficient and budget-friendly.
Choose wisely based on your requirements, goals, and budget, and start harnessing the true power of AI for your data analysis needs.
Most Loved Article List